Derek,
You need to look into InfluxDB, which is what’s known as a time-series database. It does automatic data reduction for you. For example, you can easily create a query that provides the average(the default)/min/max/median of the windspeed for a time period.
It can also automatically compress the data after some period of time, as you may want to look at detailed data when it immediately occurs, but in a month, you might only want to see what it was on an hourly basis. It’s a very different concept from a SQL type database. I’m just starting to learn it.
There are also graphical query programs that allow you to easily look at time-series data and plot them.
Node-Red is a graphical flow-based programming system that allows you to easily interface with hardware and software systems.
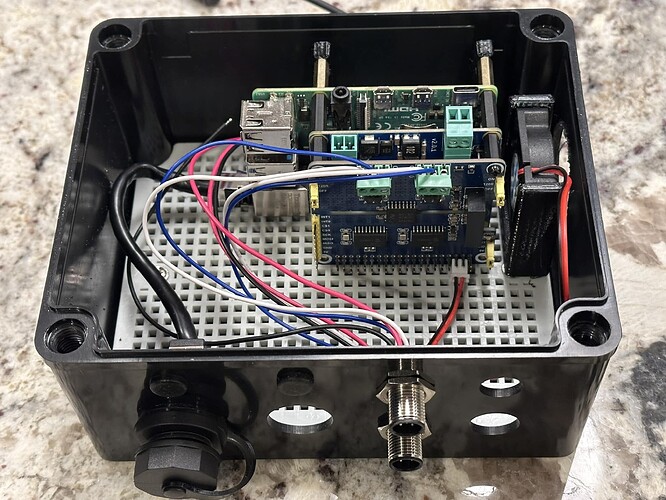
Every inverter/charger/battery on the boat broadcasts its status (voltage, current, etc.) on the N2K bus. I plan to capture all of that for later analysis. On a real-time basis, I can watch the batteries’ state of charge and notify me if it drops below a certain level. I could also have it start the generator, but the jury is out on that one.
For navigation, it will log speed/course/wind data/etc. I also have strain gauges on the shrowds, which will notify me if the loads get too high. Unlike a monohull, catamarans don’t heel to let you know the wind has picked up. I also plan to have it know what sails I have up, and if the wind changes, it will tell me that I need to change the sails, course, etc.
You can also use it to run several different chart-plotter software programs, but I don’t expect to do that.
Lastly, it will be our anchor alarm, as it will be powered up at all times. Right now, I use my iPhone, but that draws a lot of power, so you have to keep your phone plugged in. This way, if we’re off the boat, something will be monitoring our position and can send a text, email, or push notifications.
